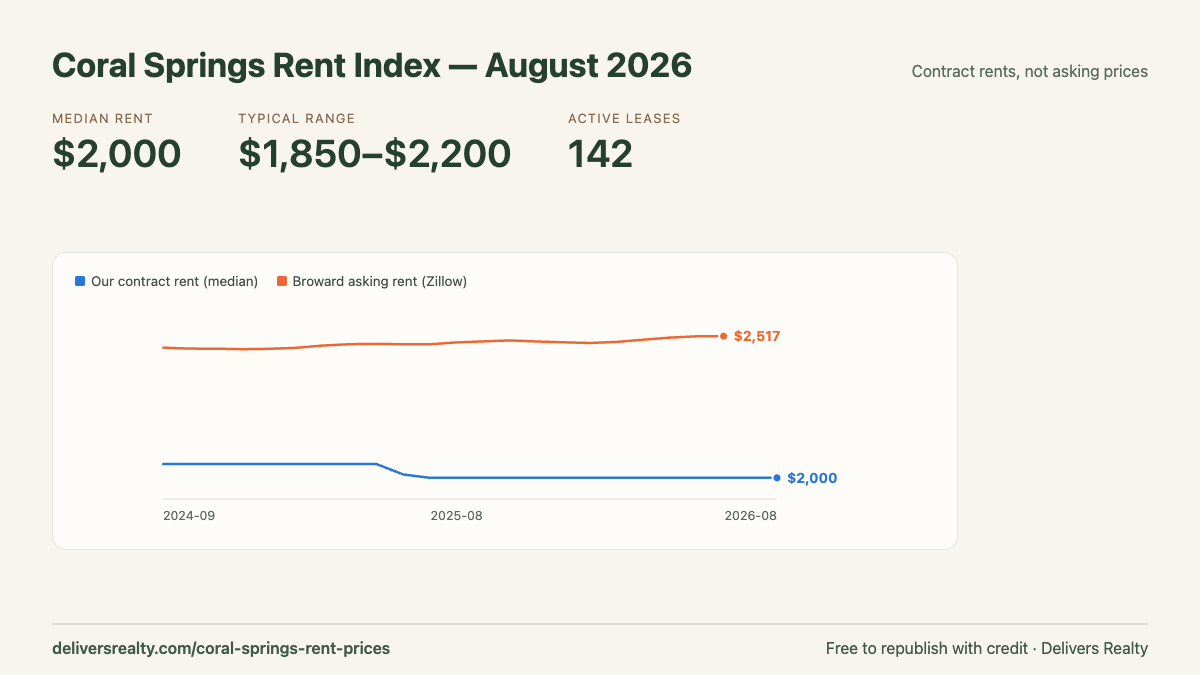
Listing sites publish asking rents — what landlords hope to get. These are contract rents: what people are actually paying right now, across every active lease in the portfolio we manage.
Median rent actually in force each month, reconstructed from dated rent schedules — every figure is a matter of record, not an estimate. Shown against Broward asking rent for contrast.
Contract rents moved from $2,050 to $1,988 over two years — about −3.0%. What people already live in barely moves, because rent is fixed for the term and most tenants renew. Asking rents swing; signed rents do not. That gap is why an advertised price is a poor guide to what a renewal should cost.
Active leases grouped by city. Cities with fewer than three active leases are left out, so these rows can total slightly less than the headline count.
Grouped by street. Communities with fewer than three active leases are left out so no single tenancy can be identified.
Current rent grouped by the year each tenancy began. Read this as tenure, not history — a 2019 row is what tenants who moved in during 2019 pay today, not what rent cost in 2019.
Tenancies that began in 2023 pay a median of $2,125 today. Tenancies signed in 2025 and 2026 sit at $1,900 — about 11% lower. Newer agreements coming in below older ones is a sign asking rents have cooled from their peak, not a measure of it.
Figures come from active leases in the Buildium portfolio managed by Delivers Realty, taken on the date shown. Rent is the contract rent on each active lease. This is one manager’s portfolio, heavily weighted toward Coral Springs condominiums — a real sample, not a census of the city. Aggregate only: no tenancy, address or tenant is identifiable, and any grouping with fewer than three leases is omitted.
Free to republish — numbers, table or chart — with attribution and a link. That is what the credit line and downloads are for.
Journalist or researcher? The index refreshes monthly from the same lease records; write us for a standing data contact.
We price against what is actually signing, not what is being asked. Happy to run the numbers on yours.